PLOTVARA / WORKSPACE
See the desktop prototype.
Actual Windows screenshots show an earlier chart view and a 16-pane local capacity test. The private v0.20 app also has candle-derived Volume Profile and local double-top and double-bottom candidates on 1D price charts, plus separate trade CSV previews for tick-count and price-range bars, Renko, Kagi, Line Break, Point & Figure, and TPO trade presence. Those controls are not shown here. Pattern candidates mark a daily shape after later bars confirm it, without checking a breakout or forecasting a move. Specialty figures are synthetic geometry; TPO blocks mark observed trades in a price bin and UTC time bracket, without inferring volume or prices between trades. Neither provides executable prices. Symbols and prices in the screenshots are synthetic demo data.
FROM THE WINDOWS PROTOTYPE
A clear view of the market history you bring.
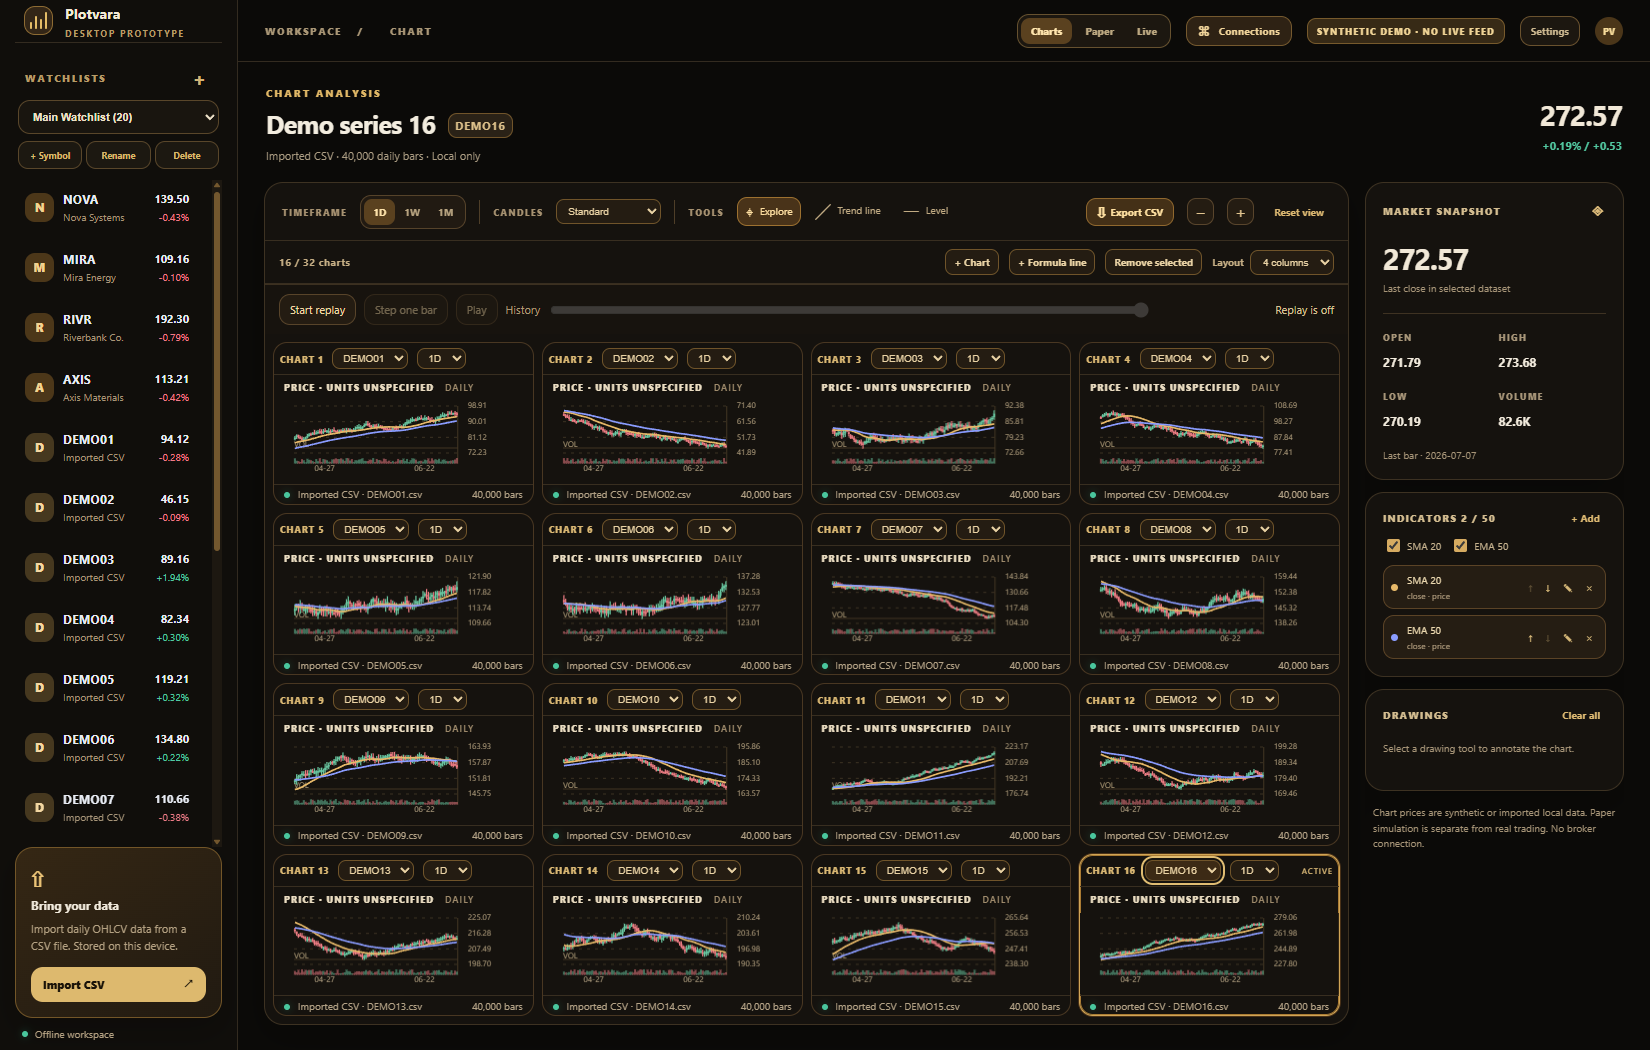
Actual prototype screenshot. The displayed prices and symbols are synthetic demo data.

LOCAL MULTI-CHART TEST
Sixteen distinct charts in one workspace.
The current desktop prototype supports up to 32 local panes. This screenshot shows 16 different synthetic daily series, with each pane backed by 40,000 local test bars. It demonstrates the grid layout using imported files; live-feed, integrated intraday charts, mobile, and paid-plan availability are still in development.
A SIMPLE START
From file to insight,
without the clutter.
- 01
Bring a daily CSV
Start with the included synthetic sample, or import your own OHLCV history in the private Windows app. An ordered trade CSV opens in a separate local preview for bars, specialty figures, and TPO; it does not feed these daily charts or replay.
- 02
Arrange and explore
Build a grid or Freeform layout, add studies, an approximate Volume Profile, or daily shape candidates, then step through history in replay or try a Paper scenario.
- 03
Keep or share your context
Export visible bars, or choose an optional AI or read-only MCP connection. You control what leaves the workspace.
Charts and sample values shown here are illustrative. This software is for research and education; it does not execute trades or provide investment advice.