Read the whole move.
Candlesticks, volume, moving averages and a responsive crosshair bring price and context into one view.
BUILT FOR A CLEARER READ
Explore price history, mark what matters, and bring chart context into your AI workflow with an opt-in assistant and a local read-only MCP bridge. Start with sample data, then bring your own OHLCV CSV. A lower priced membership is planned for the commercial release.
Preview data is illustrative. No live exchange feed or broker connection is included.
FROM THE WINDOWS PROTOTYPE
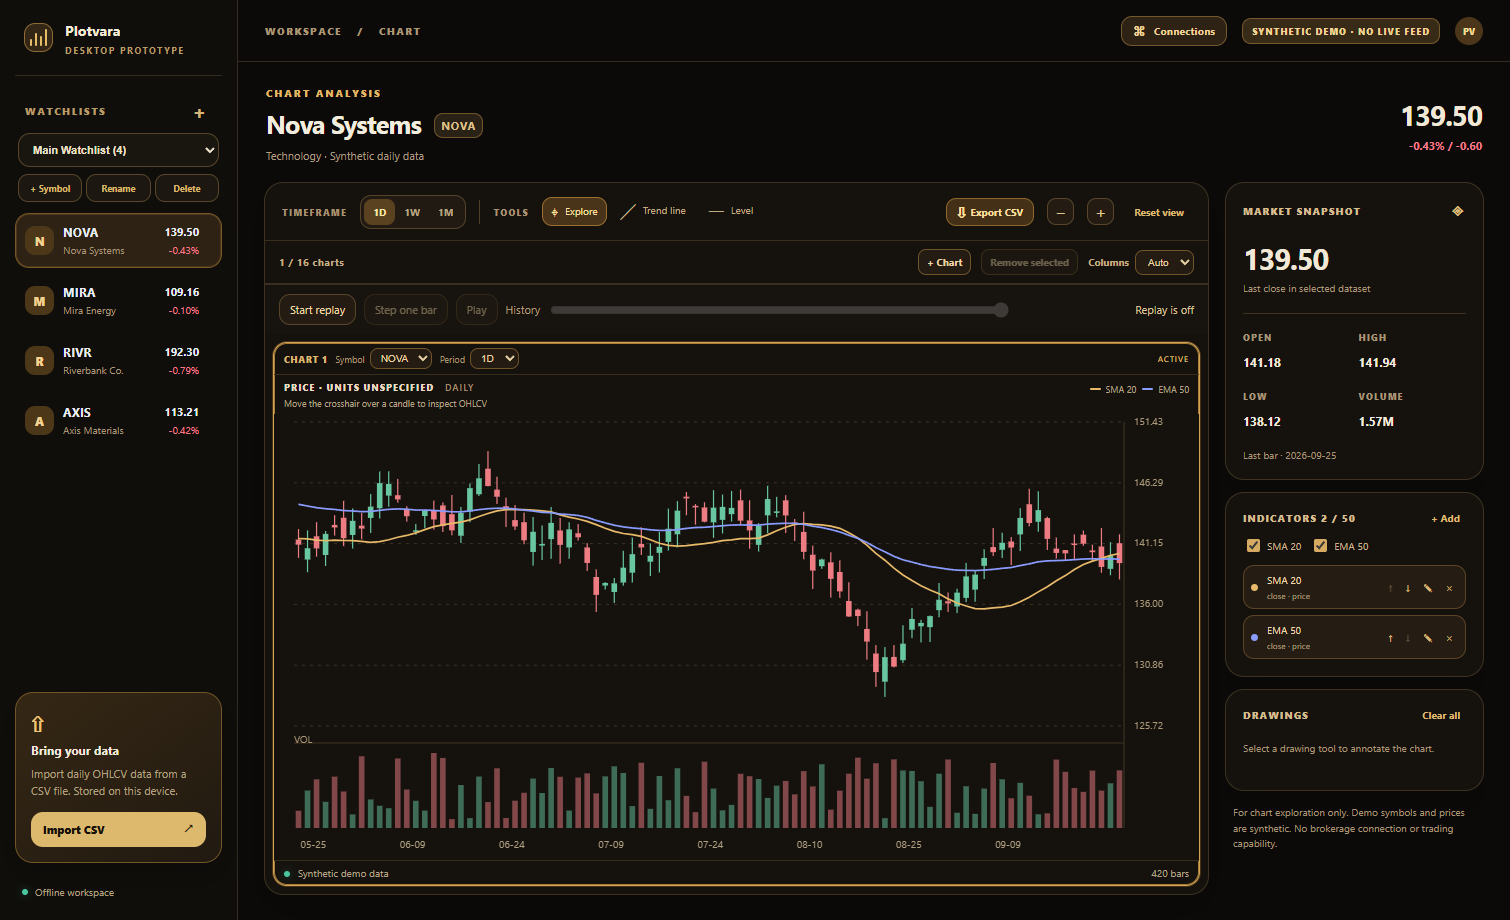
Actual prototype screenshot. The displayed prices and symbols are synthetic demo data.
THE WORKSPACE
A focused charting surface with a path to connect chart data to your own AI tools. The preview begins with local files and an explicit connection flow.
Candlesticks, volume, moving averages and a responsive crosshair bring price and context into one view.
Add simple levels and trend lines directly to the chart, then return to the same local workspace.
Send a chart summary to your own AI endpoint, or share a local read-only chart snapshot with an MCP client you configure.
Import your own CSV history and keep the source clear. Provider feeds will be added only with appropriate data rights.
A SIMPLE START
Explore the included illustrative sample first.
Load a CSV with time, open, high, low, close and volume columns.
Opt into an AI endpoint or share read-only chart context through MCP.
AVAILABILITY
The app and storefront are being built. The first preview uses illustrative data, imported CSV files, and opt-in AI/MCP connections. A membership priced below a comparable TradingView paid tier is the target; exact pricing and included services will be set before checkout opens.
Purchases are not open yet. No payment or order is collected on this page. AI provider and market-data charges, if any, will be disclosed separately.
Charts and sample values shown here are illustrative. This software is for research and education; it does not execute trades or provide investment advice.